
The 2012 Rhode Island Kids Count Factbook was released yesterday morning, and though some areas are showing statistical improvement, others are evidence that the recession is having a negative impact …
This item is available in full to subscribers.
We have recently launched a new and improved website. To continue reading, you will need to either log into your subscriber account, or purchase a new subscription.
If you are a current print subscriber, you can set up a free website account by clicking here.
Otherwise, click here to view your options for subscribing.
Please log in to continue |
|
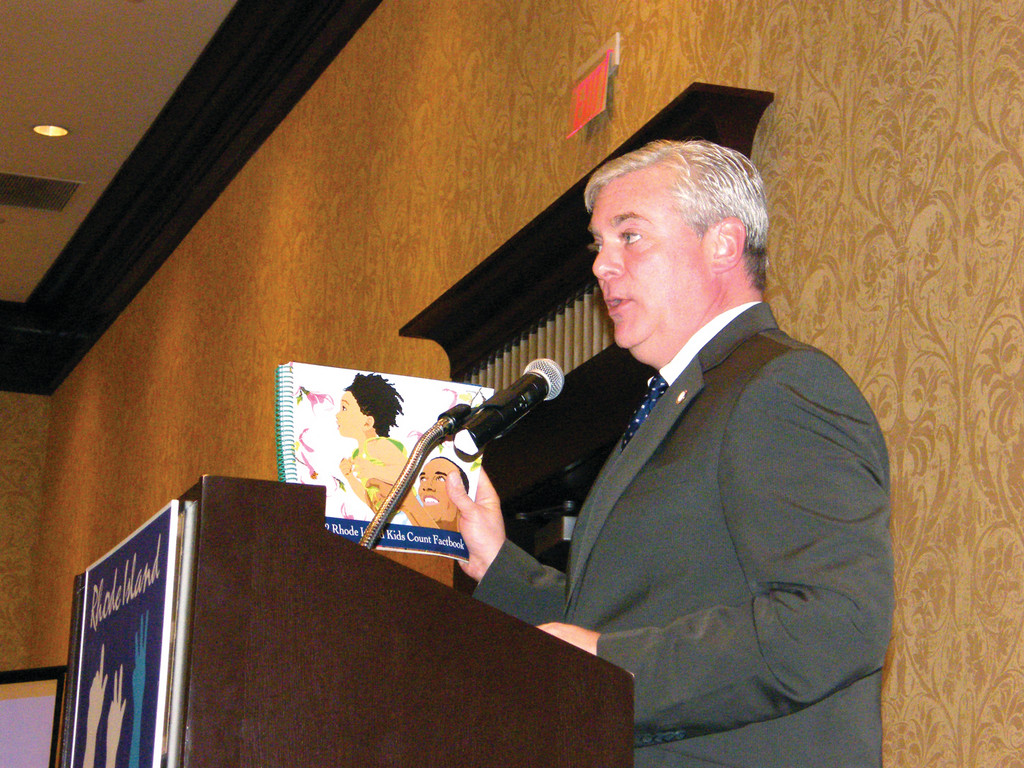


The 2012 Rhode Island Kids Count Factbook was released yesterday morning, and though some areas are showing statistical improvement, others are evidence that the recession is having a negative impact on Rhode Island’s children.
“These are tough times, and there’s a lot of bad news,” said Lieutenant Gov. Elizabeth Roberts at a breakfast attended by about 400 people at the Crowne Plaza. “But there’s a lot of good news in this Factbook, too.”
Kids Count is a policy organization that provides information on children’s well-being. The Factbook is a compilation of data on five areas of study: family and community, economic well- being, health, safety and education.
“We’re really excited to see some really positive trends,” said Elizabeth Burke Bryant, executive director of Rhode Island Kids Count.
Some of the positive trends Bryant referred to include a drop in childhood obesity rates among children ages 2 to 5 from 2005 to 2011, though there was some fluctuation in between. Another positive trend was seen at the Training School, which had a total of 669 youth at some point during 2011, down from 821 in 2010.
Other positive trends were seen in childhood obesity for youth entering kindergarten, which is down from 2004 to 2005. However, obesity is up from 2008 to 2010. Obesity in children and teens 6 to 19 has been steadily increasing.
Data shows new school menus and increased programming to combat childhood obesity has taken effect, and Rhode Island school meals are now among the healthiest in the nation.
Still, Rhode Island had some negative trends that Bryant says are linked to the economy.
“The recession is hitting families hard across the boards,” she said.
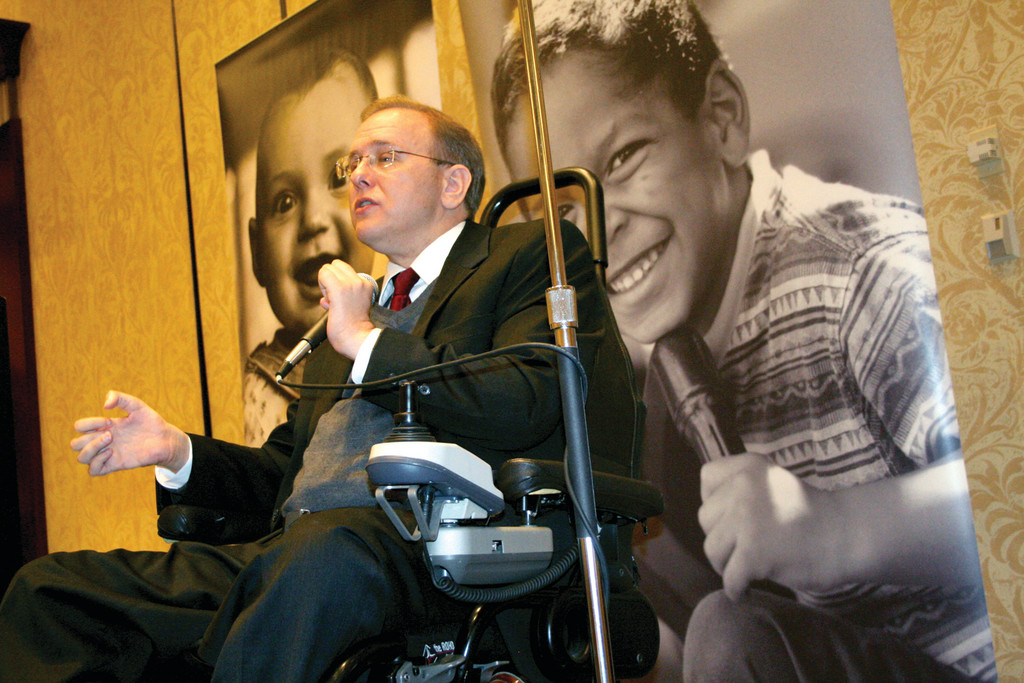
Joan Lombardi, former deputy assistant secretary for Early Childhood Development Administration for Children and Families, a branch of the U.S. Department of Health and Human Services, served as yesterday’s keynote speaker, and touched upon the issue of Rhode Island’s economy.
“The younger you are, the poorer you are,” she said.
Lombardi said four steps could help put Rhode Island on a better track. Primarily, the effort to support families must be increased, she said. Families should be more engaged in schools and after care programs, and children should be emotionally connected to their families. She said the state should refocus on children in extreme poverty and on building communities. Lastly, there should be a leadership that is better representative of the state’s cultural diversity.
Julian Santiago, a high school sophomore, spoke about the Young Voices Rhode Island program.
“I would feel helpless if I didn’t have the skill I have today,” said Santiago, who doesn’t want to be another minority statistic. “Youth can play a role in making policies. We do have a voice and we can make a difference.”
The 2012 Kids Count Factbook data shows the recession has had an effect on poverty levels, which are up from prior years. According to U.S. Census Data, Rhode Island has the worst poverty levels for children in New England, the 22nd in the country.
Kids Count data shows 17 percent of Rhode Island’s children are living in poverty, which means their annual household income is less than roughly $22,000. More than half of those children live in Rhode Island’s core cities of Pawtucket, Providence, Woonsocket and Central Falls. In Warwick, 8.1 percent of children live in families below the federal poverty threshold.
“Half of those living in poverty in the core cities are living in extreme poverty,” said Bryant.
Those in extreme poverty have an annual household income of less than approximately $11,400.
These figures correlate with Rhode Island’s economic state, and high unemployment rate. According to Kids Count, 12 percent of Rhode Island children had at least one unemployed parent in 2011.
In the four core cities with the highest poverty rates, there are also higher rates of teen births, child abuse and neglect and chronic absenteeism in early grades. In Warwick, the teen birth rate is 21.3 percent, lower than the statewide average of 27 percent. Births to mothers with less than a high school diploma hangs at a steady 8 percent this year, as does the statewide average of 16 percent. The rate of children with incarcerated parents in Warwick is 7.8 percent, versus the statewide 10.9 percent.
Bryant said the solution to these problems lies in access to health care and education.
“We really need to concentrate on education,” she said. “Reading is the gateway to the rest of education.”
Congressman David Cicilline echoed Bryant’s sentiment.
“The best investment we have is in kids; the rest will take care of itself,” he said. “We must ensure they have hope, access to education and health care. Their zip code should not determine their access to quality education.”
And there’s good news on the education front. Rhode Island’s state pre-K program, which has seven classrooms in urban communities, was recognized as one of five programs in the country that meet all recommended quality benchmarks. There’s also been an increase in full-day kindergarten, with 64 percent statewide, and 10 percent of Warwick kindergarteners enrolled in a full-day program for the 2011-2012 school year. Warwick’s 21 percent student enrollment in special education exceeds the state average of 18 percent.
NECAP scores show eighth grade reading scores to be on the up and up, with 77 percent of Rhode Islanders scoring at or above proficiency. High school graduation rates are up statewide (77 percent) and locally. In 2011, the Warwick graduation rate was 82 percent, up from 75 percent in 2010.
“There’s still a lot of work to do, but we’re headed in the right direction,” said Bryant.


1 comment on this item Please log in to comment by clicking here

bendover
Why you are at it, why not print the legislative grants bestowed on this group over the years as well as print the salary of this groups members.
Wednesday, April 4, 2012 Report this