Sean McGoey

Jeff Swensen // Getty Images
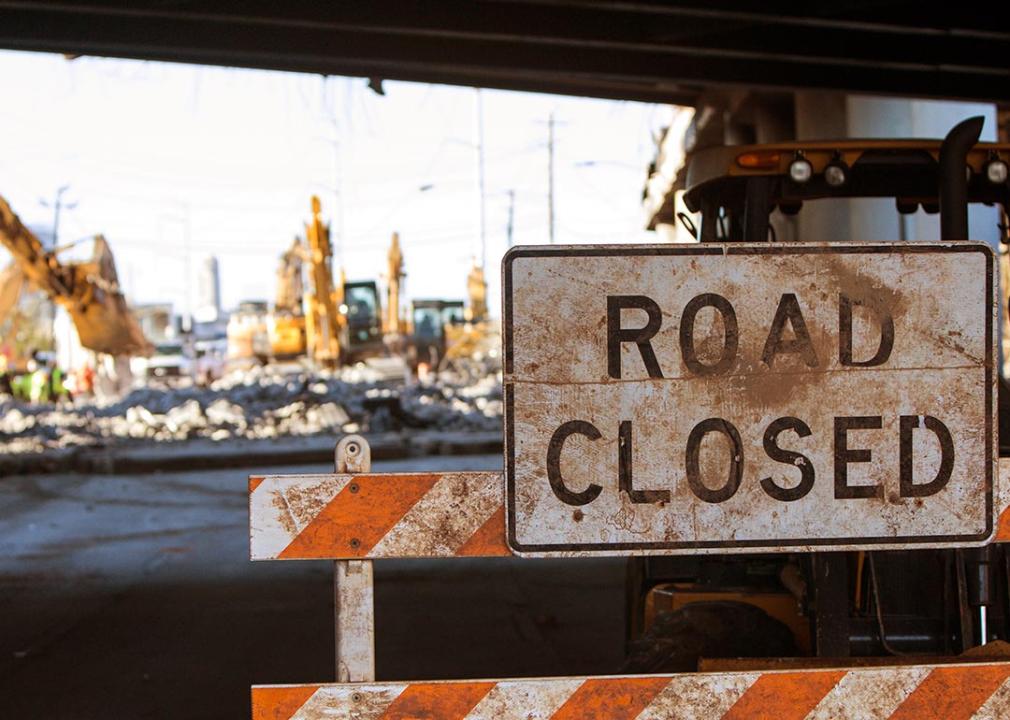
The tragic collapse of the Francis Scott Key Bridge in Baltimore has brought the issue of infrastructure safety to the forefront of national media attention.
When a bridge fails, it puts lives at risk, dramatically affects traffic and commutes, and disrupts the supply chain. Though the cause of this collapse was unrelated to the condition of the bridge, there are bridges across the country that are in poor condition and may present a safety risk to those who use them.
For example, the National Transportation Safety Board determined in February that maintenance and oversight failures were behind a 2022 bridge collapse in Pittsburgh that injured 10 people.
Despite multiple maintenance and repair recommendations, a critical plate was allowed to corrode and fracture over time, leading to the Fern Hollow Bridge collapsing on the morning of January 28 and falling about 100 feet into Frick Park.
Fortunately, no one was killed in that collapse. But bridge failures can lead to incredibly high death tolls, as in 1967, when 1,460 feet of the Silver Bridge spanning between Point Pleasant, West Virginia, and Gallipolis, Ohio, fell into the Ohio River and 46 people died.
Additionally, poor or failing bridges can lack important traffic safety features, increasing the risk of car accidents or injuries to motorists, even if they do not collapse.
So to better understand the condition of bridges across the United States, Bridgford, Gleason & Artinian Law analyzed records of more than 600,000 bridges throughout the country, in order to determine which states have the most bridges that are in need of repair or replacement, as graded by engineers and inspectors. The data is current as of Jan. 23, 2023, and therefore does not account for the recent tragedy at the Francis Scott Key Bridge in Baltimore, which collapsed on March 26 after a container ship lost power and collided with one of the bridge's concrete columns.

Key findings
BluIz60 // Shutterstock
- 10.8% of bridges nationwide are rated in poor condition.
- Four states have less than 5% of their bridges in poor condition, led by Texas — which has the 26th-highest number of poor-condition bridges, but more than twice as many total bridges as any other state.
- Iowa has the most bridges in poor condition, with over 5,000, but the highest rate is in South Carolina, the only state where more than 1 in 4 bridges are poorly rated.
Which state has the worst bridges in the country?
Below, the states are ranked by the highest percentage of all bridges that are in poor structural condition.
51. Texas
- Total bridges: 56,313
- Bridges in poor condition: 1,087 (1.9%)
- Closed bridges: 79 (0.14%)
50. Arizona
- Total bridges: 8,544
- Bridges in poor condition: 169 (2.0%)
- Closed bridges: 1 (0.01%)
49. Delaware
- Total bridges: 874
- Bridges in poor condition: 18 (2.1%)
- Closed bridges: 0 (0.00%)
48. Nevada
- Total bridges: 2,090
- Bridges in poor condition: 85 (4.1%)
- Closed bridges: 1 (0.05%)
47. Minnesota
- Total bridges: 13,502
- Bridges in poor condition: 714 (5.3%)
- Closed bridges: 33 (0.24%)
46. Washington D.C.
- Total bridges: 252
- Bridges in poor condition: 14 (5.6%)
- Closed bridges: 0 (0.00%)
45. Connecticut
- Total bridges: 4,362
- Bridges in poor condition: 245 (5.6%)
- Closed bridges: 8 (0.18%)
44. Maryland
- Total bridges: 5,473
- Bridges in poor condition: 312 (5.7%)
- Closed bridges: 10 (0.18%)
43. Florida
- Total bridges: 12,881
- Bridges in poor condition: 753 (5.8%)
- Closed bridges: 17 (0.13%)
42. New Mexico
- Total bridges: 4,037
- Bridges in poor condition: 242 (6.0%)
- Closed bridges: 13 (0.32%)
41. Virginia
- Total bridges: 14,068
- Bridges in poor condition: 858 (6.1%)
- Closed bridges: 27 (0.19%)
40. Ohio
- Total bridges: 26,960
- Bridges in poor condition: 1,741 (6.5%)
- Closed bridges: 7 (0.03%)
39. Wyoming
- Total bridges: 3,131
- Bridges in poor condition: 212 (6.8%)
- Closed bridges: 3 (0.10%)
38. Tennessee
- Total bridges: 20,373
- Bridges in poor condition: 1,385 (6.8%)
- Closed bridges: 52 (0.26%)
37. Indiana
- Total bridges: 19,381
- Bridges in poor condition: 1,457 (7.5%)
- Closed bridges: 60 (0.31%)
36. Colorado
- Total bridges: 8,954
- Bridges in poor condition: 712 (8.0%)
- Closed bridges: 1 (0.01%)
35. Wisconsin
- Total bridges: 14,412
- Bridges in poor condition: 1,153 (8.0%)
- Closed bridges: 19 (0.13%)
34. New Jersey
- Total bridges: 6,820
- Bridges in poor condition: 560 (8.2%)
- Closed bridges: 14 (0.21%)
33. Alabama
- Total bridges: 16,176
- Bridges in poor condition: 1,364 (8.4%)
- Closed bridges: 200 (1.24%)
32. Georgia
- Total bridges: 15,058
- Bridges in poor condition: 1,281 (8.5%)
- Closed bridges: 43 (0.29%)
31. Alaska
- Total bridges: 1,675
- Bridges in poor condition: 154 (9.2%)
- Closed bridges: 12 (0.72%)
30. California
- Total bridges: 25,818
- Bridges in poor condition: 2,390 (9.3%)
- Closed bridges: 33 (0.13%)
29. Illinois
- Total bridges: 26,873
- Bridges in poor condition: 2,596 (9.7%)
- Closed bridges: 85 (0.32%)
28. North Carolina
- Total bridges: 18,817
- Bridges in poor condition: 1,822 (9.7%)
- Closed bridges: 40 (0.21%)
27. Idaho
- Total bridges: 4,588
- Bridges in poor condition: 453 (9.9%)
- Closed bridges: 2 (0.04%)
26. Kentucky
- Total bridges: 14,493
- Bridges in poor condition: 1,453 (10.0%)
- Closed bridges: 60 (0.41%)
25. Massachusetts
- Total bridges: 5,281
- Bridges in poor condition: 549 (10.4%)
- Closed bridges: 16 (0.30%)
24. Utah
- Total bridges: 3,109
- Bridges in poor condition: 332 (10.7%)
- Closed bridges: 1 (0.03%)
23. New York
- Total bridges: 17,573
- Bridges in poor condition: 1,898 (10.8%)
- Closed bridges: 80 (0.46%)
22. Vermont
- Total bridges: 2,856
- Bridges in poor condition: 322 (11.3%)
- Closed bridges: 13 (0.46%)
21. New Hampshire
- Total bridges: 2,537
- Bridges in poor condition: 287 (11.3%)
- Closed bridges: 13 (0.51%)
20. Mississippi
- Total bridges: 17,573
- Bridges in poor condition: 1,897 (11.3%)
- Closed bridges: 246 (1.47%)
19. Michigan
- Total bridges: 11,341
- Bridges in poor condition: 1,331 (11.7%)
- Closed bridges: 53 (0.47%)
18. Washington
- Total bridges: 8,421
- Bridges in poor condition: 1,022 (12.1%)
- Closed bridges: 6 (0.07%)
17. Montana
- Total bridges: 5,218
- Bridges in poor condition: 636 (12.2%)
- Closed bridges: 11 (0.21%)
16. Oklahoma
- Total bridges: 22,872
- Bridges in poor condition: 2,805 (12.3%)
- Closed bridges: 141 (0.62%)
15. Maine
- Total bridges: 2,521
- Bridges in poor condition: 353 (14.0%)
- Closed bridges: 5 (0.20%)
14. Pennsylvania
- Total bridges: 23,257
- Bridges in poor condition: 3,269 (14.1%)
- Closed bridges: 183 (0.79%)
13. Arkansas
- Total bridges: 12,962
- Bridges in poor condition: 1,893 (14.6%)
- Closed bridges: 28 (0.22%)
12. Missouri
- Total bridges: 24,617
- Bridges in poor condition: 3,988 (16.2%)
- Closed bridges: 196 (0.80%)
11. Louisiana
- Total bridges: 12,717
- Bridges in poor condition: 2,145 (16.9%)
- Closed bridges: 139 (1.09%)
10. Oregon
- Total bridges: 8,292
- Bridges in poor condition: 1,499 (18.1%)
- Closed bridges: 6 (0.07%)
9. Rhode Island
- Total bridges: 782
- Bridges in poor condition: 146 (18.7%)
- Closed bridges: 5 (0.64%)
8. West Virginia
- Total bridges: 7,323
- Bridges in poor condition: 1,386 (18.9%)
- Closed bridges: 19 (0.26%)
7. South Dakota
- Total bridges: 5,889
- Bridges in poor condition: 1,116 (19.8%)
- Closed bridges: 63 (1.07%)
6. Hawaii
- Total bridges: 1,190
- Bridges in poor condition: 228 (19.2%)
- Closed bridges: 3 (0.25%)
5. Nebraska
- Total bridges: 15,348
- Bridges in poor condition: 3,038 (19.8%)
- Closed bridges: 179 (1.17%)
4. Kansas
- Total bridges: 24,907
- Bridges in poor condition: 4,975 (20%)
- Closed bridges: 1 (0.004%)
3. North Dakota
- Total bridges: 4,280
- Bridges in poor condition: 875 (20.4%)
- Closed bridges: 70 (1.64%)
2. Iowa
- Total bridges: 23,720
- Bridges in poor condition: 5,039 (21.2%)
- Closed bridges: 375 (1.58%)
1. South Carolina
- Total bridges: 9,481
- Bridges in poor condition: 2,642 (27.9%)
- Closed bridges: 58 (0.61%)
Data source and methodology
Data for this analysis comes from the 2023 National Bridge Inventory, an annual survey conducted by the Federal Highway Administration's Office of Bridges and Structures.
Data on nearly 620,000 bridges in the United States was downloaded to determine the percentage of bridges in each state that were deemed to be in poor structural condition (including those that have been closed for rehabilitation or replacement).
Each open bridge is rated on a scale from 2-9, with 9 as the best possible rating, while closed bridges receive a 0. A bridge is classified as being in poor condition if it receives a rating of 4 ("meets minimum tolerable limits to be left in place as is") or below.
This story was produced by Bridgford, Gleason & Artinian Law and reviewed and distributed by Stacker Media.