
MoneyGeek ranks nearly 200 U.S. cities based on population, educational attainment, income and homeownership to determine the best and worst cities for Asian Americans to prosper.
This item is available in full to subscribers.
We have recently launched a new and improved website. To continue reading, you will need to either log into your subscriber account, or purchase a new subscription.
If you are a current print subscriber, you can set up a free website account by clicking here.
Otherwise, click here to view your options for subscribing.
Please log in to continue |
|

As one of the fastest-growing demographics in the United States, Asian Americans are making serious headway in education and income. More than 59% of Asian Americans over 25 hold a bachelor's degree, up 8% over 10 years. Median income in Asian American households was roughly $107,000 in 2022 — 43% higher than the national median household income. Despite growing success for Asian Americans, 61% said hate against their group was increasing as of March 2024. And although recent FBI data suggests a downward trend in anti-Asian hate crimes, 2022 was still higher than years past.
To get a better picture of the best and worst cities for Asian Americans to prosper, MoneyGeek analyzed and ranked 178 U.S. cities based on population, educational attainment, income and homeownership among Asian Americans. We also compared the top 20 cities across two points of crime data per 100,000 residents: the cost of crime and racially motivated hate crime. We learned that California cities tend to offer the best financial climate for Asian Americans, with a few exceptions.
Key Findings
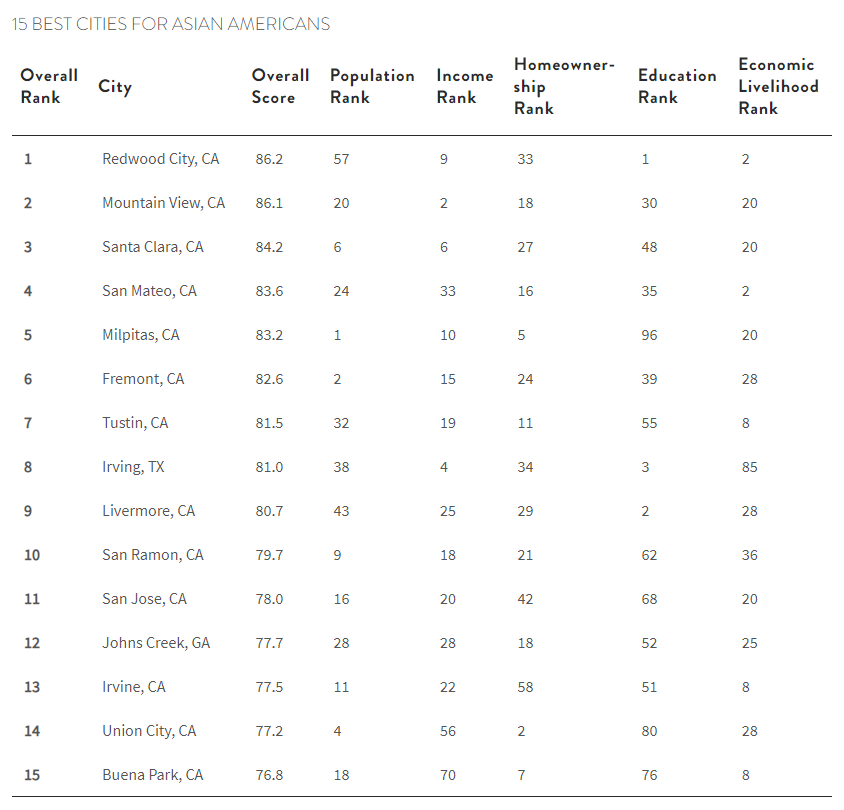
Redwood City, California, ranks No. 1 for Asian American prosperity overall, ranking first for educational attainment, second for economic livelihood and ninth for income. Nine of the top 10 cities for Asian Americans are in California — all ranking in the top 40 across income, homeownership and economic livelihood categories. Of the cities in the overall top 10, highlights include Mountain View, California, where Asian Americans have the highest median income ($160,631) with reasonable living costs, and Milpitas, California, where 73% of the population is Asian American, and there's a 76% Asian American homeownership rate.
Irving, Texas, joins California cities in the top 10, ranking No.8 overall with high scores in educational attainment (third-best) and income (fourth-best). Just outside the top 10, Johns Creek, Georgia, ranks No.8 for median individual earnings ($105,787) and No.7 for the percentage of Asian Americans with a bachelor's degree or higher (82%), all while maintaining low living costs.
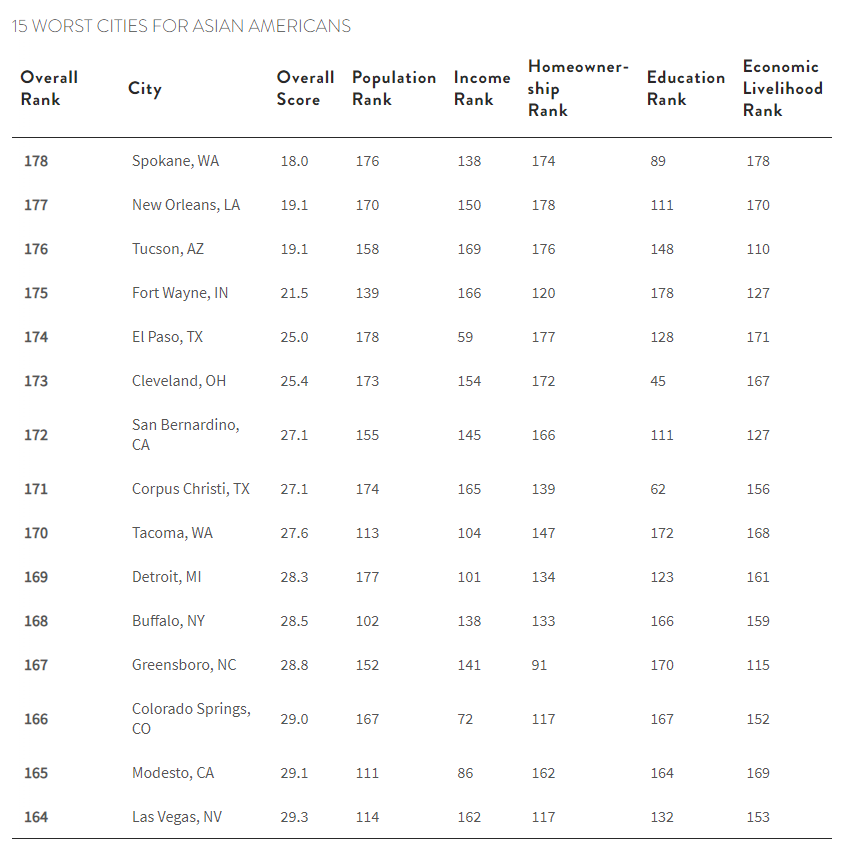
Spokane, Washington, is the least financially prosperous city for Asian Americans, joined by Tacoma, a fellow Evergreen State city in the bottom 10. Both cities are in counties with general population unemployment rates over 6% and housing costs exceeding 31% of Asian American income.
Despite many California cities being in the top 10, San Bernardino, California, ranks in the bottom 10, with an Asian American population below 5% and high housing costs. Also near the bottom are Philadelphia and San Antonio, two of the 10 largest U.S. cities. Both rank lowest in income metrics for Asian Americans and have living costs above the national average.
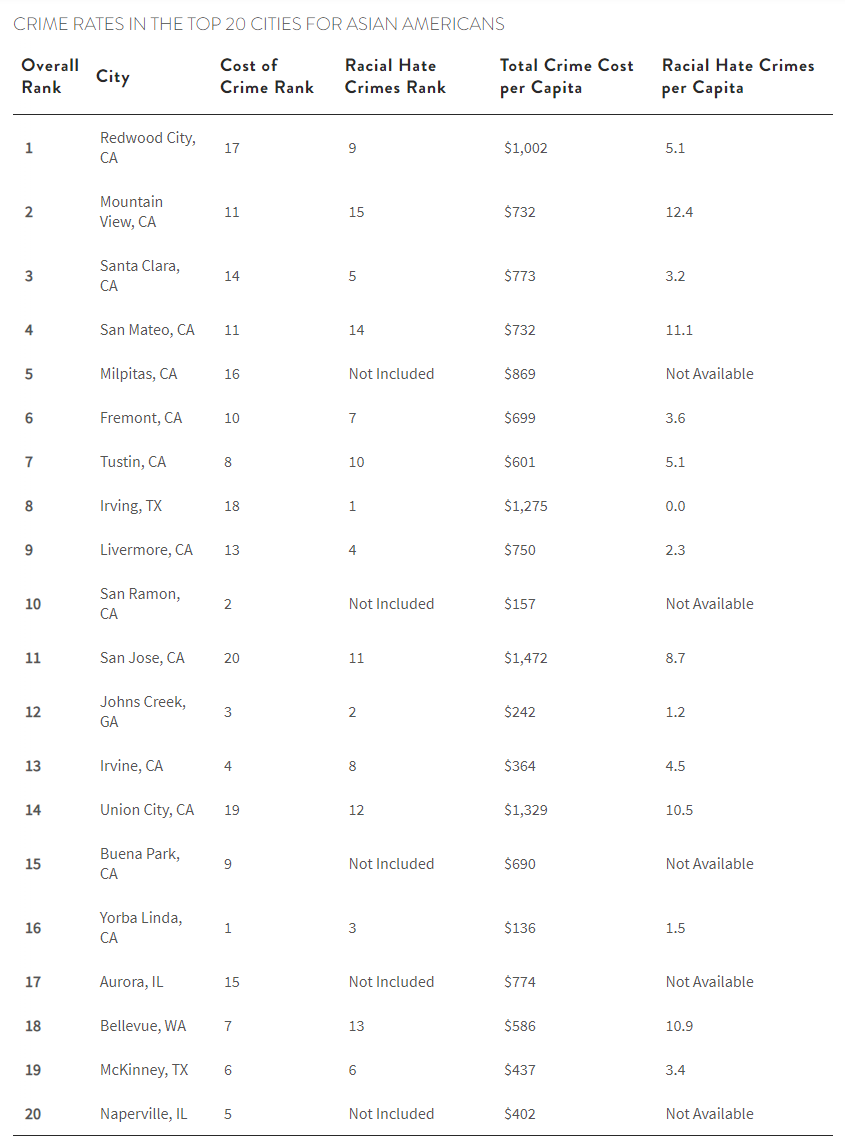
Among the top 20 cities, two California cities — Yorba Linda and San Ramon — and Johns Creek, Georgia, stand out for low crime costs — all below $250 per capita with populations under 90,000. Yorba Linda and Johns Creek also have fewer than two racially motivated hate crimes per 100,000 people. Among top-ranking cities with populations over 148,000, Irvine, California, and McKinney, Texas, keep crime costs under $500 per capita and racially motivated crimes below 4.5 per 100,000 people.
Despite ranking first overall, Redwood City, California, has high crime costs at over $1,000 per capita. When it comes to racially motivated hate crimes, Redwood City falls into the middle of the pack (five per 100,000 people). Two California cities in the top five (San Mateo and Mountain View) have racial hate crime rates of 12 and 11 per 100,000 people. San Jose, California, and Union City, California, have the highest crime costs of this group — $1,472 and $1,329 per 100,000 people, respectively.
Part of achieving financial success involves understanding and leveraging available opportunities. Here are several key strategies that Asian Americans can consider when looking to improve their finances:
Maximize scholarships
To support your educational aspirations without incurring debt, exploring scholarships for Asian students can uncover a variety of financial aid options tailored to your cultural background and academic interests.
Plan for retirement
Starting your retirement planning early allows you to harness the power of compound interest. Understanding different retirement savings strategies can set a solid foundation for a secure financial future.
Choose the right mortgage
With various mortgage options available, finding the right one can significantly impact your financial well-being. Learning about the different types of mortgages can help you make an informed decision that aligns with your long-term financial goals.
Understand your mortgage payment
When considering homeownership, it's essential to understand how your mortgage payments will fit into your budget. Using a mortgage calculator can help estimate monthly payments, including interest and principal, based on various loan scenarios.
To rank the best cities for Asian Americans, MoneyGeek analyzed data from the Census' American Community Survey and Annual Business Survey, MoneyGeek's Safest Cities and Safest Small Cities and Towns studies, the Bureau of Labor Statistics and MIT's Living Wage Calculator. MoneyGeek started with over 600 cities in the United States with populations of 63,000 or more. Places without granular data about Asian Americans or lacking other data points for the analysis were removed to reach the final set of 178 cities.
The ranking of the best cities for Asian Americans was based on five factors: population, income, homeownership, education and economic livelihood. Each factor was weighted equally. The factors were calculated as follows:
Percent of local population that is Asian American (full weight): This percentage represents the proportion of Asian Americans within a city's total population, as reported by the United States Census Bureau's one-year American Community Survey (ACS) from 2022, the most recent data available.
Income (full weight): This factor equally comprises three metrics:
Homeownership (full weight): This factor equally comprises two metrics:
Educational attainment (full weight): This factor equally comprises two metrics:
Economic livelihood (full weight): This factor equally comprises two metrics:
We also considered crime in the top 20 cities to get a better understanding of the local environment. This exploration consists of two metrics:
This story was produced by MoneyGeek and reviewed and distributed by Stacker Media.